
Capital Modelling | The Standard
- Rika Taute
- May 7
- 3 min read

Capital Requirement | Making the standard view useful
Capital requirement views are often treated as a compliance summary.
They show how the SCR is split between insurance risk, market risk, counterparty risk, operational risk, and diversification.
That is useful context. But it is rarely enough to support a decision.
The question is usually not only what the SCR is made of. It is whether the capital profile is changing, why it is changing, and whether the business is still comfortable with the risk it is carrying.
The Decision Question
Is the capital requirement changing in a way that is consistent with the business we think we are writing?
A one-year SCR split answers a static question:
· Where is capital allocated today?
· Which risk modules dominate the total?
· How much diversification benefit is being recognised?
A growing insurance risk charge may be expected if premium and exposure are growing. A rising market or counterparty component may be harder to explain if the underwriting story has not changed. A falling SCR may be positive, or it may simply reflect a reinsurance structure that has transferred risk at a cost.
The decision question becomes: are we comfortable with both the level of capital and the direction of change?
Default Practice
The standard chart is usually a stacked bar or waterfall showing the latest SCR by risk module.

If the chart is built one level deeper, insurance risk can then be split into premium risk, reserve risk, catastrophe risk, lapse or expense risk where relevant, and any other model-specific sub-components.
Why this works:
· It is familiar to boards, regulators, and senior management.
· It gives a quick sense of which risk modules matter most.
· It reconciles back to the reported SCR.
For a point-in-time capital pack, this is a reasonable starting point.
Where the Default Breaks Down
The standard view becomes less useful when the discussion moves from reporting to decision-making.
What the standard chart shows | What it does not show |
Current SCR composition | Whether the composition is stable or changing |
Largest risk modules | Whether growth is volume-driven, mix-driven, assumption-driven, or model-driven |
Diversification benefit | Whether the benefit is becoming more or less material over time |
A clean reconciliation to total SCR | Whether the capital story aligns with underwriting, reserving, and reinsurance decisions |
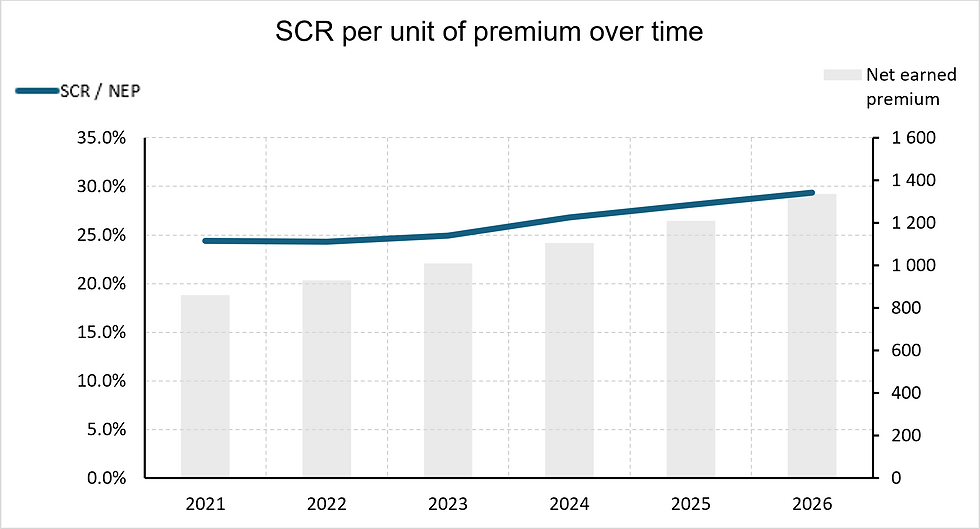
Suggested Improvement: Show the SCR Split Over Time
Keep the familiar SCR component chart, but show it across several years.
Instead of one stacked bar, use a series of stacked bars by year, with the total SCR clearly visible and the component colours kept consistent.

What This Immediately Reveals
Signal | Example of what to look for | Possible interpretation |
Total SCR trend | Is capital rising faster than premium, exposure, or reserves? | Risk intensity may be increasing, not just business volume. |
Component mix | Is one module becoming a larger share of total SCR? | The portfolio may be shifting towards a different source of risk. |
Operational risk | Is the operational component moving with scale? | May indicate growth in activity rather than insurance risk. |
Counterparty risk | Is it increasing after reinsurance changes? | Risk may have moved from insurance loss volatility to credit exposure. |
This changes the conversation from: "What is the SCR made of?" to:
"What is changing in the capital profile, and does that make sense?"
Trade-offs & Risks
This view is still a summary. It improves the standard chart, but it does not explain every driver.
· Model changes can look like risk changes unless they are clearly annotated.
· Inflation, growth, mix, reinsurance, and reserve movements can all affect the same component.
· Diversification can be hard to explain if it is shown as a negative bar without context.
· A multi-year view can create false precision if prior years are not on a comparable basis.
The chart should therefore include short notes for material methodology or business changes.
Without that, the reader may over-interpret movement that is actually driven by recalibration, data changes, or model scope.
Decision Boundary
Use this when... | Don't use this when... |
The audience already understands the standard SCR split | The audience needs a first introduction to capital modelling |
You want to explain how the capital profile has changed over time | The components are not comparable across years |
Capital, reinsurance, or portfolio growth decisions are being discussed | The question is a detailed model validation question |
You need to connect capital movement to the business story | You cannot explain material model or methodology changes |
The upgraded view shows whether the capital requirement is changing, where the change is coming from, and whether that change is consistent with the portfolio narrative.
But capital is still being shown at a high level.
In the next edition, we move from risk modules to portfolio decisions: which parts of the business are using the most capital relative to the return they generate?


Comments