
Capital Modelling | SCR Per Unit of Premium Over Time
- Rika Taute
- 2 days ago
- 4 min read

In the previous edition, we decomposed the movement in capital.
That helped explain what changed. But once the movement is understood, a simpler and sharper question remains.
For every unit of premium we write, how much capital are we now carrying?
A portfolio can grow premium, report a comfortable solvency ratio, and still become less attractive from a capital perspective. The issue is not only whether the SCR is increasing. It is whether the SCR is increasing faster than the business it supports.
The Decision Question
Is growth becoming more capital intensive?
If premium grows by 10% and SCR grows by 25%, the capital story has changed. Growth may still be desirable, but it is no longer only a volume story. It has become a capital allocation story.
The practical test is simple: is each unit of premium now arriving with more capital strain than before?
Default Practice
Most capital packs show SCR and premium in separate places.
The SCR is discussed in the capital section. Premium is discussed in the business performance or planning section. The solvency ratio may then sit in a third place altogether.
That separation makes it harder to see whether the portfolio is scaling efficiently. A higher SCR may be acceptable if it follows profitable, well-priced growth. It is more concerning if the same premium now requires materially more capital.
Separate views can show | What they do not show |
Premium growth | Whether growth is capital efficient. |
Total SCR movement | Whether capital is rising faster than the business. |
Solvency ratio | Whether the underlying portfolio is becoming more capital intensive. |
Component movement | Whether each unit of premium now requires more capital. |
Where the Default Breaks Down
The total SCR can tell a reassuring story while the underlying capital intensity is deteriorating.
This can happen when growth shifts into more volatile classes, higher limits, weaker rate adequacy, lower diversification, or a reinsurance structure that changes the retained risk profile. It can also happen after model recalibration, where the business has not changed but the measured capital strain has.
The default view often answers: are we solvent? It does not always answer: are we using capital better or worse than before?
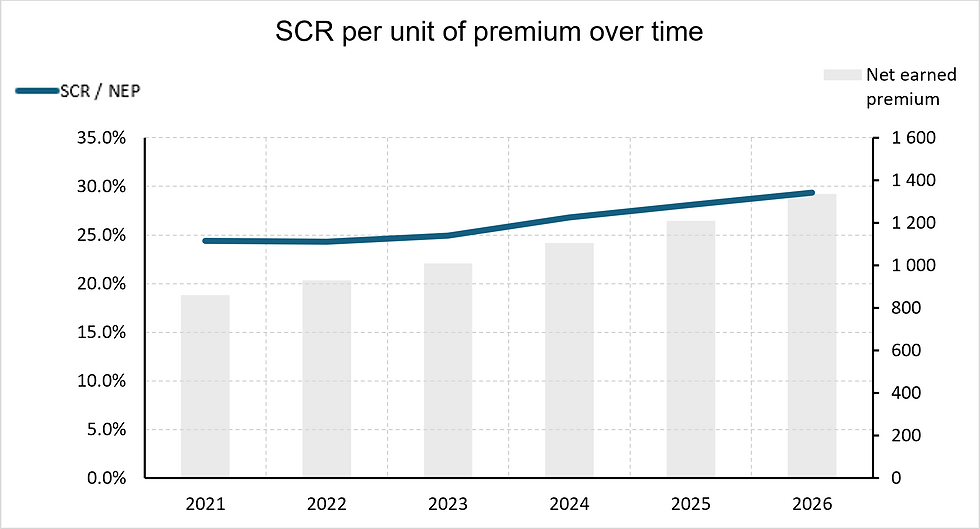
Suggested Improvement: SCR Per Unit of Premium Over Time
Create a simple time-series view that shows capital intensity directly.
The core metric is SCR divided by a consistent premium base. Net earned premium is often a useful starting point because it reflects retained, earned exposure. Gross written premium, net written premium, earned exposure, or expected underwriting margin may be better depending on the decision question.
The value of the chart is its simplicity. It turns a capital movement into a capital efficiency question.
What This Immediately Reveals
This view changes the conversation from: "How much did capital move?" to: "Is the business becoming more capital intensive as it grows?"
Pattern | Possible interpretation | Follow-up question |
SCR per premium is stable | Capital is broadly scaling with the business. | Is the return on that capital acceptable? |
SCR per premium is rising | The business is becoming more capital intensive. | Is growth coming from riskier mix, weaker diversification, or model change? |
SCR per premium is falling | Capital intensity is improving. | Is this genuine risk reduction or a temporary effect? |
Premium grows but intensity worsens | Growth may be lower quality from a capital perspective. | Is the growth aligned with risk appetite? |
Trade-offs & Risks
The main risk is denominator choice.
Different premium bases can tell different stories, especially where there is fast growth, reinsurance change, portfolio mix shift or earning pattern distortion.
Premium base | Caveat |
Gross premium | Shows underwriting scale but may ignore risk transfer. |
Net premium | May reflect reinsurance structure as much as underlying risk. |
Earned premium | Can lag recent growth or portfolio change. |
Expected margin | Can be more economically meaningful but depends on assumptions. |
The denominator should therefore match the decision. For growth quality, premium may be enough. For capital efficiency, SCR relative to expected underwriting margin may be the stronger follow-up view.
The metric also needs context. A rising SCR per premium can be acceptable if pricing, margins, and risk appetite support the move. A falling ratio can be misleading if it comes from temporary reinsurance, model treatment, reserve releases, or a denominator that has grown before risk has emerged.
Decision Boundary
SCR per unit of premium is not a full capital model.
It does not replace allocation, movement attribution, diversification analysis, or return on capital. But it is a useful pressure test because it puts growth and capital on the same page.
The decision boundary is this: if growth is accompanied by a rising SCR per premium ratio, management should not treat the movement as scale alone. It should test whether the new business is priced for the capital it consumes, whether the mix remains inside risk appetite, and whether reinsurance or diversification assumptions are doing too much of the work.
If the ratio is stable or falling, the question does not disappear. The follow-up becomes whether the improvement is structural, profitable, and repeatable.
Use this when... | Don't use this when... |
You need a simple view of whether growth is capital efficient. | Premium is not a meaningful exposure measure for the portfolio. |
Capital and premium have moved in different directions. | The premium base has changed definition across years. |
The audience needs a clear board-level capital metric. | The question is detailed model attribution. |
You want to compare capital intensity over time. | Recent years are distorted by one-off transactions or accounting changes. |


Comments